
Effective Strategies to Improve Your Facebook Ads Conversion Rate
Discover key strategies to optimize your Facebook Ads conversion rate. Practical advice to maximize your advertising results.
Discover key strategies to optimize your Facebook Ads conversion rate. Practical advice to maximize your advertising results.
A Facebook conversion rate can go from 2% to 10%... without touching the budget. What makes the difference? Behavioral targeting, ad creatives, message visibility, and above all, consistency between the ad and what users see on your website or online store.
Don't panic if your Facebook ads are generating clicks without results: by adjusting your campaign settings, your target user profile, and your ad formats (stories, carousel, video…), you can get back on track.
👉 We show you step by step how to boost your results and promote your business more effectively on social media.
The conversion rate on Facebook Ads is the proportion of people who take a specific action (purchase, sign-up, contact form…) after clicking on your ad.
The formula is simple:
➗ Conversion rate = (Number of conversions / Number of clicks) x 100
It's a fundamental KPI for measuring the real effectiveness of your campaigns: a good CTR without conversions is just smoke and mirrors. What counts is business impact.
Many marketers confuse conversion rate with other KPIs like CTR, CPC, or CPA. Yet each measures a different stage in the funnel.
1. KPI: CTR (Click-Through Rate)
Definition: Clicks ÷ Impressions
Objective: Measure the attractiveness of your ad.
2. KPI: CPC (Cost Per Click)
Definition: Total cost ÷ Clicks
Objective: Measure the cost of a click.
3. KPI: CPA (Cost Per Acquisition)
Definition: Total cost ÷ Conversions
Objective: Measure the cost of a conversion.
4. KPI: Conversion Rate
Definition: Conversions ÷ Clicks
Objective: Measure post-click effectiveness.
👉 The conversion rate is the missing piece if you want to know whether your clicks are actually worth something.
In B2B, sales cycles are longer, audiences more targeted, and each lead costs you more. The Facebook Ads conversion rate therefore becomes the true profitability indicator.
👉 In short: if you rely solely on CTR, you risk missing what really matters for your business.
In 2025, the average conversion rate on Facebook Ads sits around 9.21% across all sectors (source: Wordstream). But beware: this figure can be very misleading.
It includes both highly-tuned B2C e-commerce campaigns… and B2B campaigns with long cycles and complex forms. In short, the average means little until you compare it to your own sector and conversion funnel.
Here are some average benchmarks observed in B2B on Facebook Ads (take with a grain of salt):
1. Sector: B2B SaaS
Average conversion rate: 3% to 6%.
2. Sector: Industry & manufacturing
Average conversion rate: 2% to 4%.
3. Sector: Professional services
Average conversion rate: 5% to 8%.
4. Sector: Training & education
Average conversion rate: 6% to 10%.
5. Sector: B2C e-commerce
Average conversion rate: 8% to 12%.
💡 The more technical or long-cycle your offer, the lower your rate may appear — without that being a failure.
Comparing your conversion rate to your competitor's is useful, but not sufficient. Ask yourself instead:
Your real benchmark is yourself. Track how your performance evolves over time, test, and iterate.
A good conversion rate is never an accident. It depends on your ability to define the target audience, segment your messages effectively, and align online advertising, landing page, and offer. On a social network like Facebook, everything is connected: targeting, creative, page, and measurement.
No conversions without the right target audience. On Facebook advertising, the options are rich:
💡 Tip: segment by demographic characteristics, interests, mobile vs desktop behaviors. When Facebook introduces new signals or placements, test them early.
Your ad creative is the first filter. If it doesn't land, no one will click — let alone convert.
👉 Use the creation tool in the ads manager to quickly produce format variations (image, video, carousel, stories). AI can accelerate creative variations.
Even the best advertising campaign will fail if the landing page doesn't hold up.
💬 Think ROI: if your cost per click rises but the page converts better, the return on investment remains positive.
An effective call to action = desire + direction + confidence.
No vague "Learn more." Prefer:
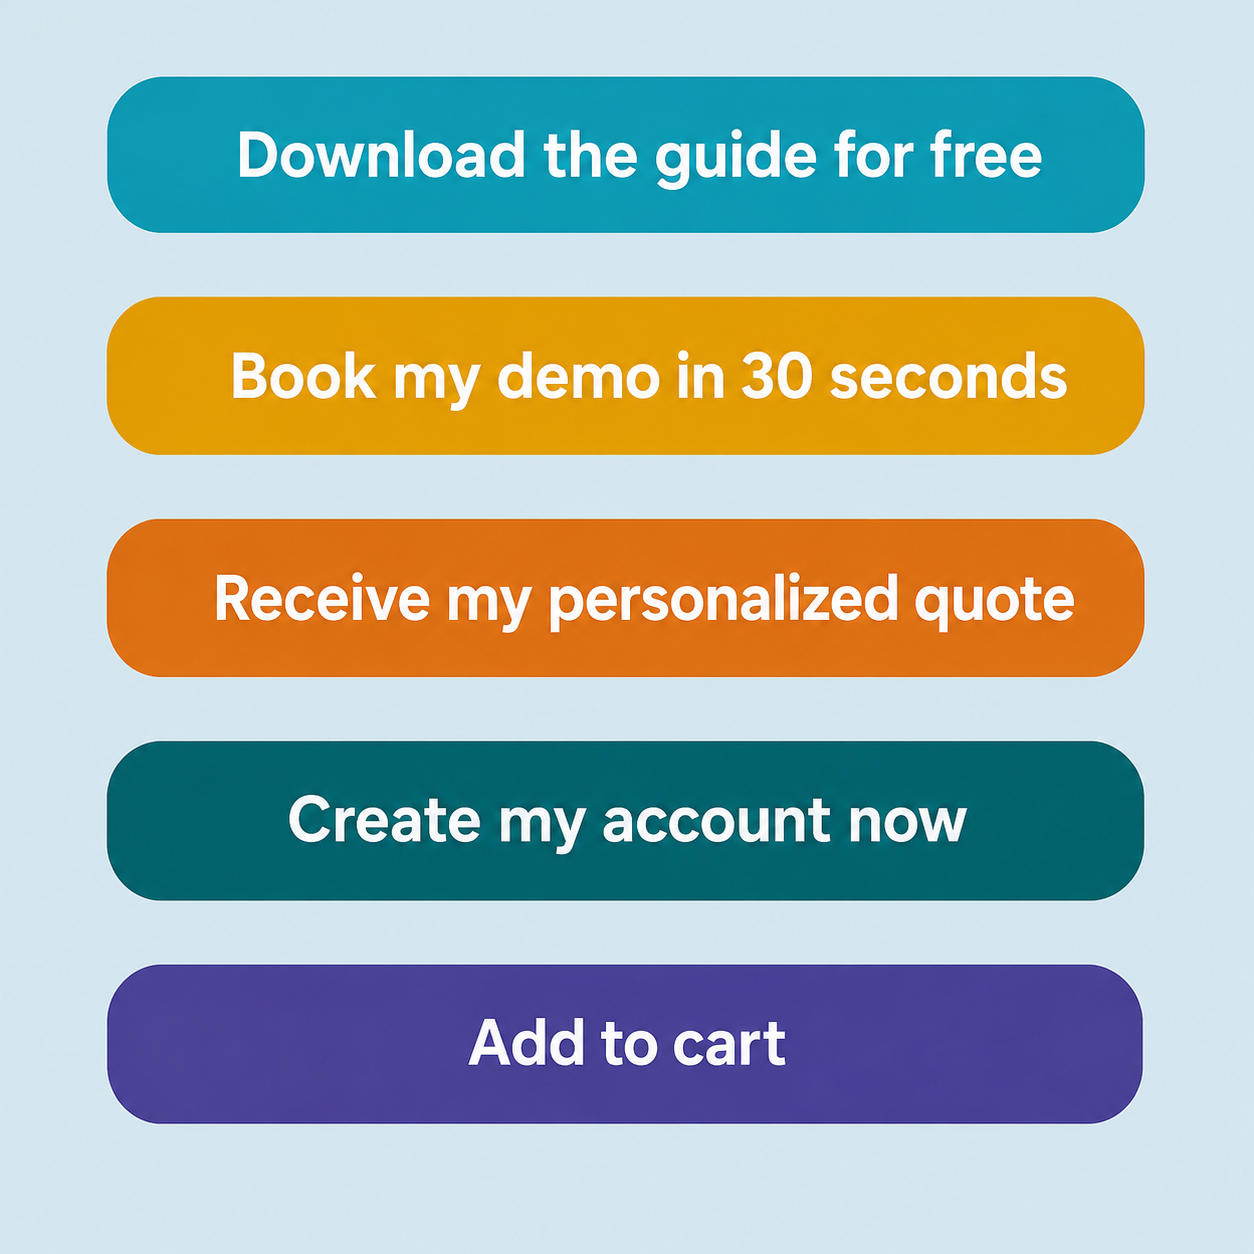
And test different formats! Even a simple change of verb can boost results by +20%.
Launching a campaign is good. Iterating continuously is where it all happens.
Simple process:
create an account → create a campaign → follow the steps to create ad sets → test audiences (targeted advertising) → iterate in the ad manager.
The Pixel + CAPI duo remains your best ally for data-driven management, not gut feeling.
[rta-block=folder-cta][rta-title=h3]Want to learn more about your paid advertising potential?[rta-title=h3][rta-btn=regular]Get a Free Audit[rta-btn=regular][rta-block=folder-cta]
You have the right ingredients — now it's time to run the recipe like a pro. The goal: turn your Facebook campaigns into a digital profitability engine, without blowing your advertising budget.
Here are the advanced settings and features to activate right now on your Business Manager account.
You can't improve what you don't measure. If you don't know what users do after clicking on your ad, you're flying blind.
The ideal approach is to use both. It's the foundation of reliable tracking and intelligent optimization.
A good A/B test is like a lab for understanding what makes people click, scroll, or convert. No need for big budgets: the key is to test one parameter at a time.
🎯 Example tests:
Minimum recommended duration: 3 to 5 days, depending on your audience size and ad format.
Most users won't buy or sign up on first contact. That's where remarketing comes in to build recurring exposure and increase brand awareness.
Repetition builds trust. And trust builds conversions.
A few often underused techniques that make a real difference:
Theory is fine. But nothing beats a good before/after to see the real impact of optimizations. And above all: know the common mistakes to avoid them from the start.
Initial issues:
Optimizations implemented:
Result:
+191% conversions, CPL divided by 2.5
Issue:
Optimizations:
Result:
Stable conversion rate back to 5.9%, CPA down 38%
A good conversion rate doesn't fall from the sky. You need to measure, understand, and adjust continuously. Here's a selection of essential tools to track your performance, identify what's blocking, and stay one step ahead.
💡 Tip: connect the Facebook pixel to GA4 for a more granular view of multi-source conversions.
Keep an eye on what the best are doing. Not to copy, but to understand what works in your vertical.
Good tracking = decisions based on data, not instinct. A growth methodology, in short!
A good conversion rate comes down to precise targeting, impactful visuals, a landing page that delivers on its promises… and continuous optimization.
Test. Analyze. Adjust. Stop wasting your budget. Switch to growth mode.
.jpeg)
Lorem
Can't find what you're looking for ? Contact us here
jordan@bulldozer-collective.comGet access to playbooks and feedback from those who are shaping the next wave of marketing and AI.


Lorem ipsum dolor sit amet, consectetur adipiscing elit. Suspendisse varius enim in eros elementum tristique. Duis cursus, mi quis viverra ornare, eros dolor interdum nulla, ut commodo diam libero vitae erat. Aenean faucibus nibh et justo cursus id rutrum lorem imperdiet. Nunc ut sem vitae risus tristique posuere.