Voir nos cas clients
Allez plus loin avec nos ressources gratuites
La newsletter de Bulldozer
Êtes-vous prêt à accélérer ?


Data Strategy: The Complete Guide 2026
How to Build a Data Strategy? Steps from Collection to Data Analysis.
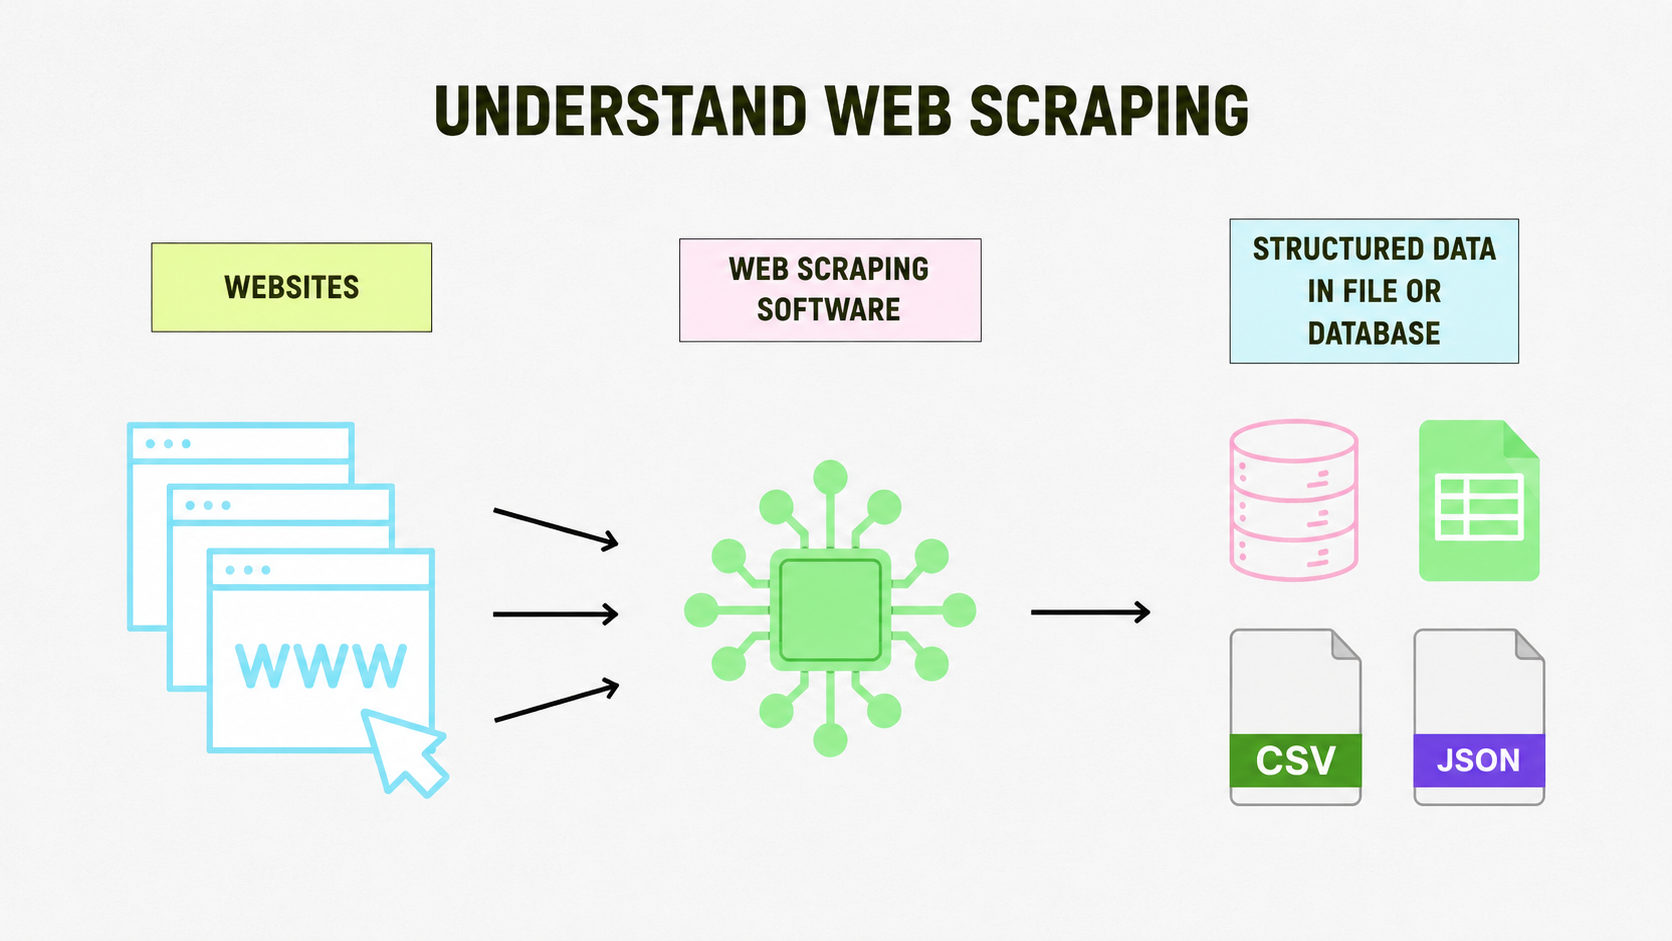
A data strategy is a structured plan to collect, organize, analyze, and leverage an organization's data to achieve specific objectives. It enables the transformation of raw data into actionable insights, facilitating decision-making, process optimization, and improved business performance.
In a world where data is the new oil, having a solid data strategy is no longer optional — it's a necessity. Whether it's to optimize decisions, improve performance, or stay ahead of the competition, a structured approach to data is your greatest asset. Discover how to move from raw collection to actionable insights that propel your business to the top of its growth curve.

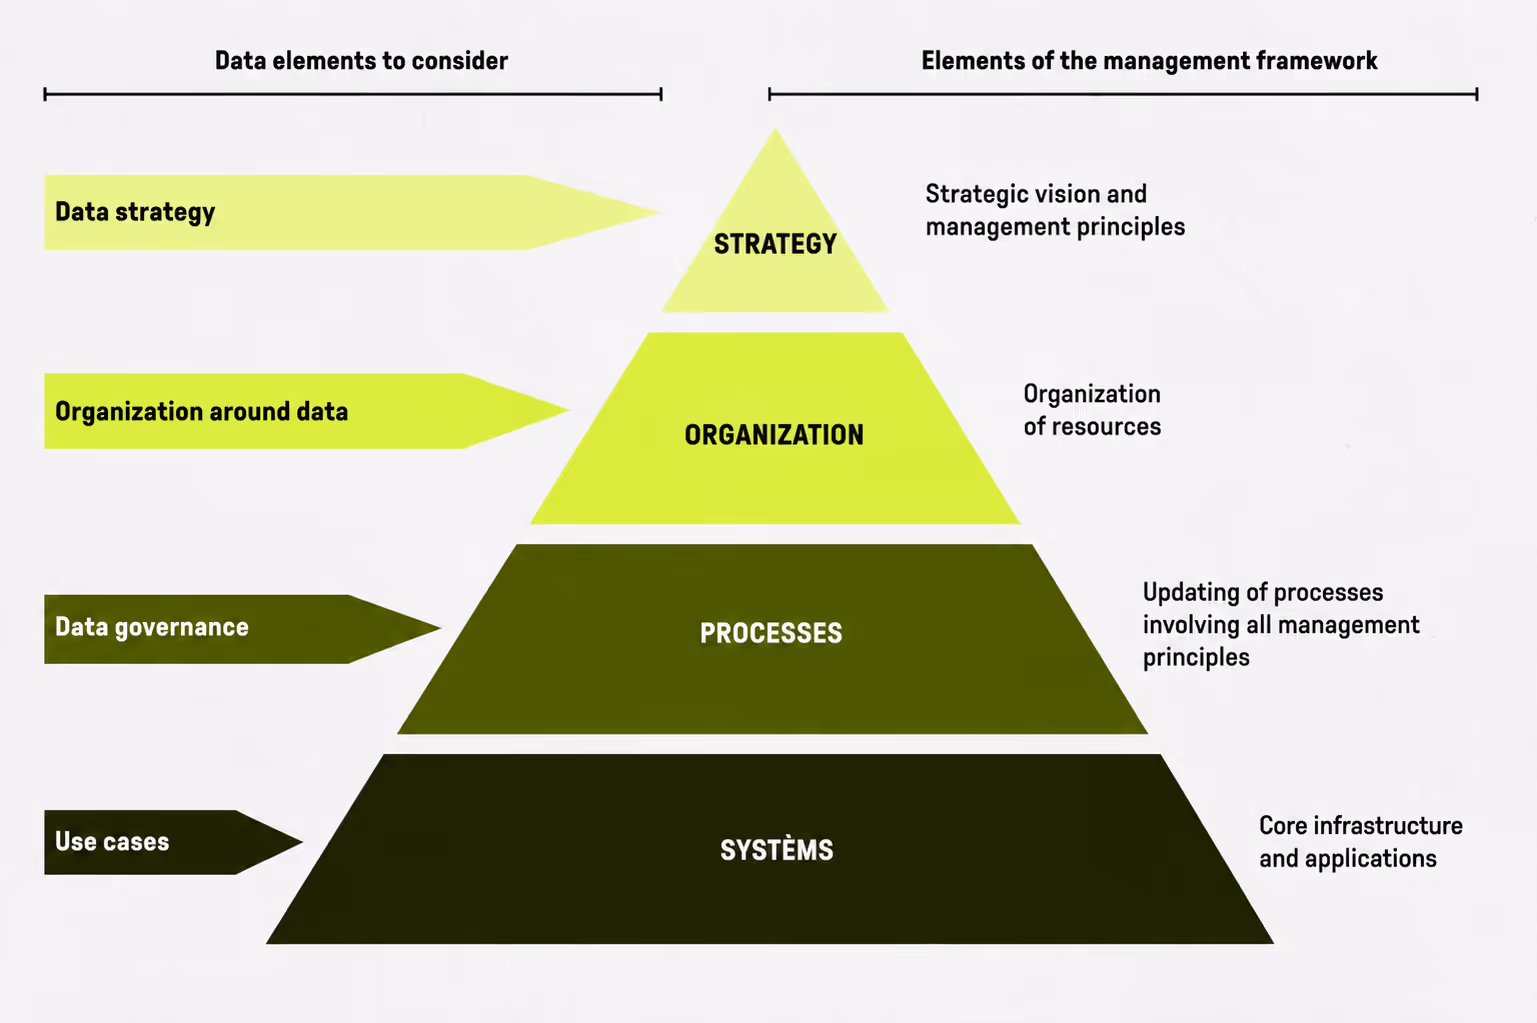
Define Clear Objectives Aligned with Business Strategy
A successful data strategy starts with clear objectives aligned with the company's overall vision. Data is not an end in itself, but a lever for achieving strategic goals such as improved decision-making, personalized customer experiences, or cost reduction.
Objectives and Vision of the Data Strategy
- Strategic objectives
- Align with the company's vision and priorities: define why and how data will be used to support your company's priorities. Objectives must reflect your organization's global ambitions, such as improving customer experience, increasing revenue, or reducing costs. If your company aims to become a leader in customer satisfaction, a strategic objective could be to analyze and respond to user feedback in real time.
- Identify key challenges or opportunities and analyze current friction points or untapped opportunities. An e-commerce business might identify a high cart abandonment rate and set a goal to reduce it by 20% through behavioral data.
- Formulate SMART objectives:
- Specific: the objective is clearly defined.
- Measurable: a precise KPI allows evaluation of success.
- Achievable: it is realistic given available resources.
- Relevant: it is aligned with business needs.
- Time-bound: it includes a deadline.
- Example: "Reduce churn rate by 15% in 12 months through improved customer segmentation."

*Source: https://smart-visibilite.fr/2020/06/24/objectif-smart/
- Associated KPIsKPIs measure the effectiveness of the data strategy. How to choose the right KPIs?
- Each KPI must correspond directly to a strategic objective to measure its progress.
- A good KPI must enable identification of concrete actions.
- Differentiate primary and secondary KPIs:
- Primary KPIs directly evaluate objective achievement (e.g.: conversion rate).
- Secondary KPIs deepen the analysis (e.g.: email open rate in a nurturing campaign).
- Adapt your KPIs to your company's lifecycle and context. Acquisition for a startup, retention for a mature company; the startup might track CAC, while the established company prioritizes LTV.
- Predictive models use historical data to anticipate future events (e.g.: predicting sales or identifying leads likely to churn). An accurate model enables optimization of targeted actions, such as retention campaigns for at-risk customers.
- Dashboards consolidate real-time data to provide a quick, clear overview. Managers can react more quickly to trends, such as adjusting stock levels or redirecting marketing efforts.
- Customer segmentation consists of grouping consumers by common characteristics (age, purchase behavior, location). Better segmentation improves campaign effectiveness, increasing conversions and maximizing customer lifetime value (LTV).
- Expected impact
- Data must generate concrete results, such as improved operational efficiency, new revenue from better customer segmentation, or cost optimization through tighter inventory management.
Key Questions to Ask
To align the data strategy with the business strategy, it is essential to answer these fundamental questions:
- What results do we want to achieve?Are you looking to reduce costs? Improve customer experience? Identify new business opportunities?
- Example: an SME may want to reduce its churn rate by using data to anticipate customer departures.
- Which decisions will be data-driven?Identify the key processes where data will play a decisive role.
- Example: in a supply chain context, data can be used to optimize demand forecasts and avoid stockouts.
Practical Example: Data Strategy for Customer Personalization
An online services company wants to personalize its user experience to increase retention.
- Alignment: this objective supports the company's mission of "putting the customer at the heart of its services."
- Objective: tailor services offered based on the usage habits of target customers.
- KPIs: 20% increase in customer satisfaction rate and 15% reduction in churn.
- Expected impact: greater loyalty and increased customer lifetime value (LTV).
Data Collection and Management
Data collection and management are foundational steps in building your data strategy. They ensure that available data is not only actionable, but also adapted to the company's strategic needs. Here are the key elements to consider:
Data Sources
Data comes from multiple internal and external channels, each offering specific insights.
- CRM (Customer Relationship Management): customer data, purchase history, commercial interactions.
- ERP (Enterprise Resource Planning): financial data, inventory management, order tracking.
- Social media: customer feedback, trends, brand mentions.
- IoT (Internet of Things): real-time data from sensors, machines, or connected objects.
Practical example: an e-commerce company can combine its CRM data to personalize recommendations with social media data to identify emerging trends.

*Source: https://www.cartelis.com/blog/creer-datawarehouse/
Data Quality
Data quality is essential to ensure reliable analyses. It rests on three main criteria:
- Accuracy: data must reflect reality without errors.
- Completeness: datasets must be complete to avoid biases.
- Consistency: data must be aligned across different sources and systems.
Practical example: a customer database containing incorrect or missing email addresses will impact the effectiveness of promotional campaigns.
Data Volume
Volume refers to the total quantity of data to manage. This can range from a small base of thousands of rows to infrastructure storing terabytes or millions of records. Companies must choose solutions adapted to their volume, such as Snowflake or BigQuery for large volumes.
Practical example: a SaaS company may manage limited customer databases, while an IoT player processes millions of data points per day from sensors.
Update Frequency
The frequency at which data is refreshed depends on specific business needs:
- Real-time: for critical decisions, such as tracking financial transactions.
- Daily: for regular reports, such as daily sales tracking.
Practical example: an IoT monitoring system for a factory requires real-time data, while a marketing performance dashboard can make do with a daily update.
Data Types
Data comes in different forms, each requiring specific management:
- Structured: databases organized in columns and rows (e.g.: Excel files, SQL).
- Unstructured: data such as videos, images, or emails.
- Semi-structured: formats like JSON or XML containing metadata but without a rigid structure.
Practical example: a streaming service processes structured data (subscribers, viewing time) and unstructured data (video content).
Rigorous data collection and management lay the solid foundations for relevant analyses and informed decisions. By identifying your sources, ensuring quality, and effectively managing volumes and types, you maximize the strategic value of available information.
Data Governance and Security
An effective data strategy rests on solid governance and rigorous security measures. These two pillars ensure data is used ethically, in compliance with the law, and protected against threats. Here are the key elements to integrate:
Applicable Regulations
Complying with applicable laws and standards is essential to avoid legal penalties and maintain user trust. In Europe, you will need to address compliance with GDPR (General Data Protection Regulation): these are the obligations for companies processing data of European citizens (e.g.: explicit consent, right to erasure).
Practical example: an international company must ensure its data collection platforms, such as Google Analytics, are configured to comply with GDPR (IP anonymization).
Security Protocol
Implement protective measures to ensure the integrity and confidentiality of the data you process:
- Encryption: sensitive data (e.g.: banking information) must be encrypted in transit and at rest.
- Strong authentication: use of robust identifiers and two-factor authentication (2FA) to access platforms.
- Firewall and monitoring: protection against unauthorized access and detection of suspicious activity.
Practical example: a SaaS platform implements AES-256 encryption and strong authentication to secure its customer data.
Data Access
Define clear roles and permissions to limit access to sensitive data to authorized users only. Standard roles include:
- Data owner: responsible for managing a dataset.
- Data analyst: access to data for analysis purposes, without the ability to modify it.
Practical example: a CRM configures access rights so that only sales managers can modify customer information.
Data Traceability
Ensure complete traceability of actions performed on data to detect anomalies and meet regulatory requirements. Traceability strengthens transparency and enables rapid response to incidents or audits. Laws such as GDPR or CCPA require documenting who accesses data, why, and how it is used; in the event of an audit or dispute, complete traceability allows demonstration of legal compliance. Logs enable rapid identification of suspicious behavior or unauthorized access (e.g.: an attempt to modify a sensitive file), strengthening the ability to respond in case of a data breach.
How to establish traceability?
- Set up audit logsLogs record all actions performed on data, such as:
- Views: who accessed the data and when?
- Modifications: what data was changed and how?
- Deletions: who deleted what data and why?
- Centralize and store logs: use software such as Splunk, ELK Stack, or AWS CloudTrail to collect and analyze logs in one place. Ensure logs are protected against unauthorized manipulation or deletion.
- Configure automated alerts: in case of suspicious access (e.g.: a user attempts to view data they are not authorized to access), alerts can be triggered.
- Make actions traceable: associate each action with a user or specific process via unique identifiers.
Well-designed governance and robust security measures are not merely legal obligations — they are also guarantees for optimizing data use with confidence. By combining regulatory compliance, access control, and proactive protection, you secure a major asset for your business.
Infrastructure and Tools
Establishing the right infrastructure and choosing the right methods are crucial steps to execute your data strategy. These elements ensure collection, storage, analysis, and integration of data while guaranteeing their accessibility and optimal use.
Storage Platforms
.png)
Data storage is the foundation of any infrastructure. The choice between cloud and on-premise solutions depends on the company's specific needs.
- Cloud: store data on remote servers accessible via the Internet, offering flexibility and scalability. Flexible, scalable, and often more cost-effective for growing companies.
- Examples: Amazon S3, Google Cloud Storage, Microsoft Azure.
- On-premise: store data locally on servers within the company, offering total control but requiring investments in maintenance and infrastructure. Better suited for organizations with high data security requirements, such as financial institutions.
- Example: physical servers using systems like Dell EMC or NetApp.
- Hybrid: combines the advantages of cloud and on-premise solutions, allowing sensitive data to be stored internally while using cloud storage for operations requiring flexibility, such as large-scale analysis.
- Example: an SME uses cloud for daily operations and on-premise storage for sensitive data.
Analytics Tools
Analytics tools transform raw data into actionable insights through visualizations, predictive models, or reports.
- BI (Business Intelligence): the set of systems and processes that transform structured data into reports, dashboards, and visualizations to facilitate decision-making. Power BI, Tableau, Looker.
- Example: a company can use BI to track monthly sales and identify top-performing products.
- Advanced analytics: goes beyond simple descriptive reports by using statistical techniques, predictive and prescriptive models to anticipate outcomes or recommend actions. For example, an advanced analytics model can predict which customers are at risk of churning and suggest retention strategies. Python, R, or SAS for predictive and prescriptive analytics.
- Example: using Python with a library like Pandas to detect sales trends.
- Big Data: refers to the processing and examination of large volumes of varied data (structured and unstructured) in real-time or near-real-time. Hadoop, Apache Spark for processing large data volumes.
- Example: a streaming company can analyze millions of user data points to recommend tailored content in real time.
Integration Technologies
Integration technologies connect different data sources to centralize and leverage them.
- Middleware: software that acts as an intermediary between different applications or systems to enable their communication and integration.
- APIs (Application Programming Interface): a set of rules and protocols that enables two applications to communicate directly with each other.
- Example: a payment API like Stripe allows an online store to process transactions by connecting to its system in a secure, standardized way.


Data Architecture
.png)
Source: https://www.linkedin.com/pulse/data-warehouse-vs-lake-lakehouse-mesh-ashish-bijawat/
The organization of data within the infrastructure is essential to optimize accessibility and processing.
- Data Lake: designed to store large volumes of raw data, whether structured, semi-structured, or unstructured. Ideal for flexible, unstructured analyses, particularly in Big Data or Machine Learning projects.
- Example: an IoT company uses a Data Lake to analyze real-time data streams without needing to organize them immediately.
- Data Warehouse: in contrast, a Data Warehouse is intended for structured analyses and BI (Business Intelligence) reports. Data is cleaned, organized, and optimized for specific needs such as reporting or performance tracking.
- Example: an e-commerce company uses a Data Warehouse to consolidate its sales, inventories, and advertising data to generate dashboards and track KPIs in real time.
- Data Mesh: a decentralized architecture in which data is managed by functional teams or domains (marketing, finance, product) who own it, while adhering to common standards to ensure interoperability.
- Example: in an organization using a Data Mesh, the marketing team can manage and share its data via APIs with the product team, enabling faster, more autonomous collaboration.
Automation
Automation simplifies and accelerates data processing by reducing human intervention.
- Automated processes: collect, transform, and analyze data through programmed workflows. Ideal for executing repetitive or complex tasks without human intervention.
- Example: an automated process can send weekly sales reports to a team using tools like Zapier or Power Automate, saving time and reducing errors.
- AI/ML utilization: Machine Learning models for predictive analytics or automated recommendations.
- Practical example: use an ML model to predict customer churn and automatically trigger a retention campaign.
By combining the right infrastructure with powerful tools, companies can maximize the value of their data while optimizing operations. The choice of technologies will depend on data volume, analytical needs, and strategic objectives.
Data Analysis
Data analysis is a crucial step in transforming raw information into actionable insights. It informs strategic decisions, optimizes operations, and identifies new opportunities. Here are the key elements of effective analysis:
Analytical Techniques
Data can be analyzed in different ways depending on needs:
- Descriptive statistics: study of historical data to understand past trends.
- Example: identify monthly sales peaks over a one-year period.
- Predictive analysis: use of models based on past data to anticipate future results.
- Example: predict which products will be most in demand during a given season.
- Prescriptive analysis: recommendations of optimal actions based on insights.
- Example: propose a promotional campaign for segments at risk of churning.
- Big Data and Machine Learning: massive, automated analysis to discover complex correlations.
- Example: a recommendation engine that adjusts suggestions in real time on an e-commerce site.
Main Use Cases
Data analysis finds applications across many domains:
- Sales forecasting: anticipate performance based on past trends and seasonality.
- Example: a SaaS company uses historical data to predict the impact of a promotional offer.
- Customer segmentation: identify homogeneous groups to personalize marketing actions.
- Example: a brand can target its regular buyers and new customers differently with specific offers.
- Cost optimization: identify inefficiencies in the supply chain or spending.
- Example: a company can analyze its supply chains to choose the most profitable supplier or adjust stock levels based on demand.
Data Visualization
Representing data clearly and interactively helps better understand and share insights.
- Dynamic dashboards: an interactive dashboard that displays data updated in real time or at regular intervals. It enables visualization of KPIs and key trends using charts, diagrams, or maps, while offering the ability to filter or explore the data.
- Example: a Power BI dashboard that tracks sales, churn, and CAC in real time.
- Specific charts:
- Line charts: to analyze trends over time.
- Heatmaps: to visualize performance or traffic zones.
- Pie charts: to show distributions (e.g., market share).
- Common tools: Tableau, Power BI, Google Data Studio.
Cross-Department Collaboration
To maximize the value of data, it must be shared and leveraged across departments.
- Example:
- Marketing: analyzing customer segments to personalize campaigns.
- Sales: using insights to prioritize the most qualified prospects.
- Product: integrating user feedback to improve features.
- Collaborative processes:
- Regular meetings to discuss key insights.
- Shared solutions to centralize data (e.g.: a common Data Warehouse).
Effective analysis combines appropriate techniques, clear visualizations, and active cross-department collaboration. By applying these principles, organizations transform data into a powerful lever for achieving their strategic and operational objectives.
.avif)