
Across 200+ growth audits at Bulldozer since 2022, one pattern comes up in 7 out of 10 cases: the company is pouring budget into acquisition when the real problem is retention.
The classic CMO reflex under pressure is to increase paid spend to compensate for customer losses. More leads come in — but the leak keeps draining. Acquisition costs climb, margins compress, and the board starts asking uncomfortable questions.
In B2B, acquiring a new customer costs between 5 and 25 times more than retaining an existing one. Yet the majority of marketing roadmaps we review allocate no more than 10 to 15% of resources to retention. The imbalance is hard to ignore.
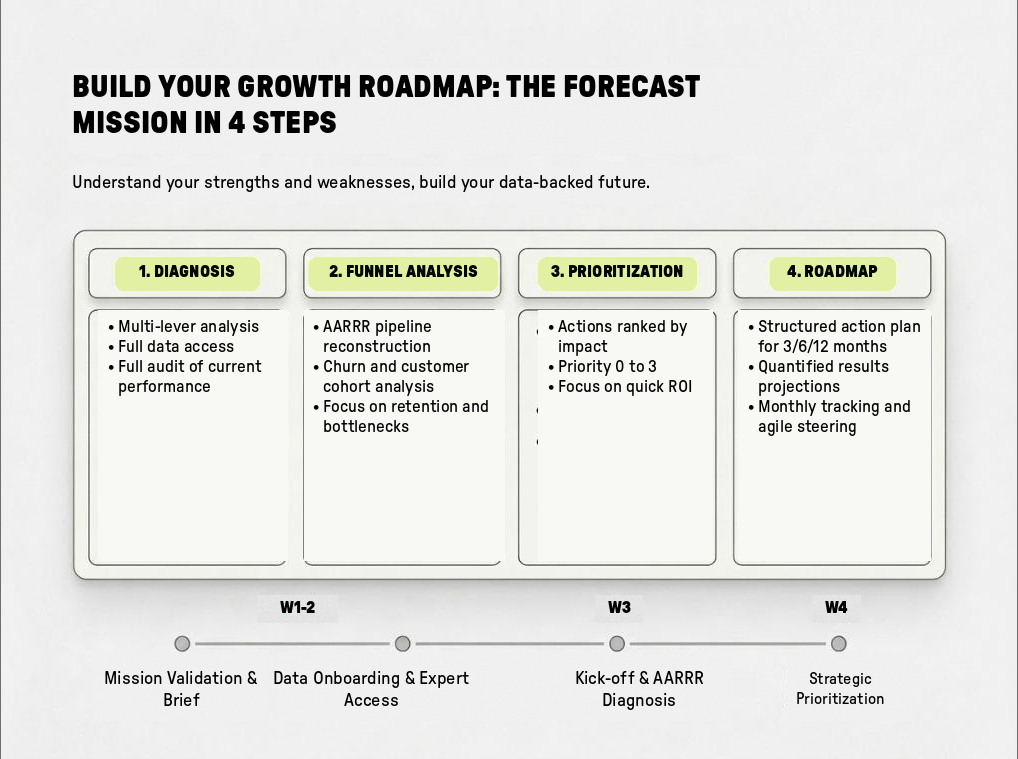
In this article, we break down the Forecast diagnostic — a 4-week engagement that maps your entire growth funnel to pinpoint exactly where revenue is leaking and prioritizes actions by level of business impact. With numbers drawn from our client work and direct feedback.
Most marketing and revenue teams treat churn as a product satisfaction problem. It's rarely that simple.
Across the Forecast engagements we've run, churn causes consistently fall into three distinct categories. First, activation failure: the customer signed, but never reached a moment of value. Onboarding was incomplete, usage remained shallow, and non-renewal followed logically. Second, positioning mismatch: the customer expected one thing, the product delivers another. The problem isn't the product — it's how it was sold. Third, no post-sale nurturing: once the contract is signed, the customer is left to fend for themselves. No structured follow-up, no guided path to value.
What we see consistently across our diagnostics: when companies start categorizing their churn reasons, they realize that 40 to 60% of departures aren't a product problem at all — they're a failure in the retention journey.
For a B2B SaaS company at Series B with €5M ARR and a 15% annual churn rate, that means €750K in revenue to replace every year just to stay flat. Add the acquisition cost of those new customers (at a median B2B SaaS CAC payback of 18 months), and the investment required to simply hold your position frequently exceeds €1M.
Conversely, moving from 15% to 10% annual churn on that same base frees up €250K in net growth capacity — and that saving compounds year after year, as every retained customer continues generating recurring revenue.
Goal: Understand your strengths and weaknesses, and build a growth roadmap for the next 3, 6, and 12 months.
The Forecast is the first engagement we propose at Bulldozer. Anchored in an analysis of past performance, present state, and future projection, it's structured around three core elements:
Duration: 4 weeks. Dedicated team: Head of Growth, Growth Manager, Paid specialist, SEO Manager, Data Analyst.
In practice, this team goes through every single growth lever in the business.
The methodological foundation is the AARRR framework (Acquisition, Activation, Retention, Referral, Revenue). For each stage of the funnel, the team collects and analyzes real company data.
We start by rebuilding the pipeline in both directions. Top-down: how many visitors does it take to generate X leads, how many leads to produce Y MQLs, how many MQLs to reach Z SQLs, how many SQLs to hit the revenue target. Then bottom-up: at what point do customers disengage, where are the bottlenecks, what is the real LTV by cohort.
One of our Heads of Growth puts it plainly: "Some clients think their problem is an acquisition problem. And we actually find they have much more work to do on retention. Constantly feeding the funnel and bringing in new customers isn't necessarily the most efficient way to grow revenue."
This is the stage where churn gets dissected. We analyze customer cohorts month by month. We segment departure reasons. We compare retention between customers who went through a structured onboarding and those who didn't. We measure the ratio between upsell and net churn.
This is where the diagnostic sets itself apart from a standard audit. Rather than delivering a list of 50 unranked recommendations, the Forecast assigns each identified action to one of four priority levels:
Priority 0 (immediate — this week) — High-impact actions that require no additional budget or resources. Example: fixing an onboarding flow that's losing 20% of new customers within their first 30 days.
Priority 1 (within the month) — High-impact actions that require a moderate investment of time or resources. Example: building a post-sale nurturing workflow that re-engages customers at D+7, D+30, and D+90 with value-building content.
Priority 2 (within the quarter) — Structural actions that require a dedicated project. Example: rebuilding customer scoring to detect disengagement signals before non-renewal.
Priority 3 (within 6 months) — Foundational work requiring significant reorganization or investment. Example: building a dedicated Customer Success team with a complete retention playbook.
The point of this framework: in an ideal world, you'd work every lever simultaneously. But no company has the resources to address everything at once. What matters is starting with whatever will have the greatest impact on the revenue line, as quickly as possible.
The final deliverable is a strategic roadmap covering 3, 6, and 12 months. It includes projected outcomes for each prioritized action, associated budgets (time, tools, hiring where necessary), and tracking metrics to validate month by month that the plan is on track.
One point worth clarifying: the roadmap is built on a snapshot taken at a specific moment in time. Markets shift, competitors move. That's why we recommend a monthly review to adjust priorities based on results and the competitive landscape.
Want to find out where your growth is leaking? Book a Forecast diagnostic →
[rta-block=folder-cta][rta-title=h3]Want to explore your Forecast potential?[rta-title=h3][rta-btn=regular href="/prendre-rendez-vous-typeform" target=_blank]Get a free audit[rta-btn=regular][rta-block=folder-cta]
At Bulldozer, we measured the impact of this prioritization approach on our own model. Between 2023 and 2024, our client revenue retention rate was 35%. By applying the same diagnostic and prioritization principles we deploy for clients — analyzing churn reasons, segmenting cohorts, rebuilding activation journeys — we moved to 66% retention between 2024 and 2025.
The decisive factor: the reasons for churn changed. Previously, the leading cause was dissatisfaction with results. Today, the leading cause is clients internalizing the capability. That's a radically different signal: the client isn't leaving because it didn't work — they're leaving because it worked so well they can now do it themselves.
One lever that consistently stands out in our cohort analysis: clients for whom we implemented tools (tracking, CRM, dashboards) show significantly higher retention than those where we delivered pure service.
The logic is straightforward. When a client uses tools you configured, switching costs increase. But more importantly, tools create visibility into delivered value. A dashboard that shows monthly pipeline or CAC evolution is a far stronger retention argument than a quarterly PDF report.
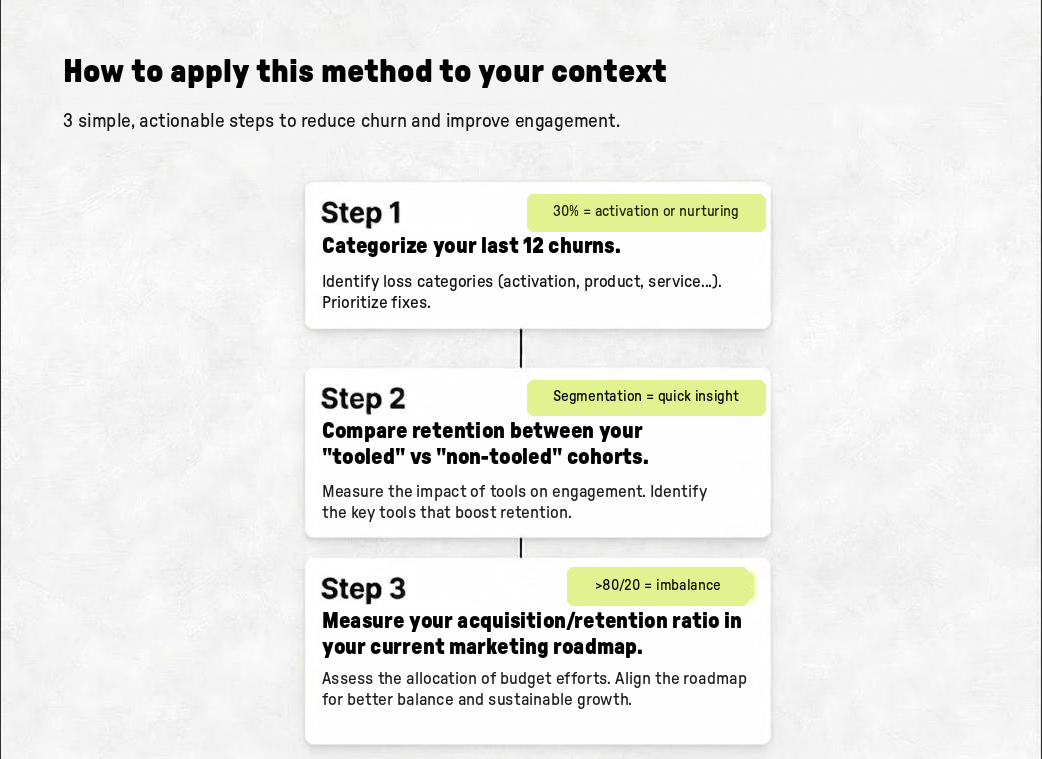
Even without launching a full Forecast engagement, three actions can be implemented this week:
1. Categorize your last 12 churned accounts. For each lost customer, identify the root cause: activation failure, result dissatisfaction, budget cuts, capability internalization, or other. If more than 30% fall under activation or nurturing, your problem isn't the product — it's the post-sale journey.
2. Compare retention rates between your "tooled" and "non-tooled" cohorts. If you don't have this data, that's already a signal. Companies that segment their cohorts by engagement level (product usage, completed onboarding, deployed tools) identify their retention levers much faster.
3. Measure your acquisition/retention ratio in your current marketing roadmap. Count the initiatives, resources, and budget allocated to acquisition vs. retention. If the ratio exceeds 80/20, there's likely a rebalancing to be done.
The Forecast has been deployed across very different profiles — from hypergrowth B2B scale-ups to SaaS vendors looking to stabilize their customer base.
PayFit — In the middle of a transition toward a Product-Led Growth model, PayFit couldn't pinpoint why results weren't materializing. The Forecast audited the entire funnel (SEA, Outbound, SEO, Data, Self-Serve), diagnosed friction points in the customer journey, and delivered a structured 6-month action plan with clear priorities.
Aircall — Aircall wanted to evaluate and challenge its marketing strategy without knowing where to start. The Forecast delivered a multi-channel audit (SEO, paid, data), a prioritization roadmap, and actionable insights — resulting in -15% CPL, +25% conversion rate, and +30% ROI on paid campaigns.
Doctolib — Doctolib wanted to better leverage its acquisition channels and reduce CPA. The Forecast uncovered the untapped potential of MQL and PQL leads, and defined an optimized acquisition strategy with a detailed action plan to maximize conversion.
More case studies are available on Bulldozer's Use Cases page.
Most B2B companies we work with don't have a growth problem. They have a leak problem they're compensating for with acquisition spend. The Forecast diagnostic isn't about adding another marketing lever — it's about looking honestly at where revenue is lost and addressing the root causes in the right order.
As acquisition costs keep rising in B2B — median CAC increased by 40% between 2022 and 2025 across the companies we analyze — retention becomes the most cost-effective growth lever available. The companies that have figured this out are the ones building their roadmap from a structured diagnostic, not from gut instinct.
→ Book your Forecast diagnostic
Lorem ipsum

Content Marketing Manager at Bulldozer, she writes about content strategy, editorial systems and distribution.
Can't find what you're looking for ? Contact us here
jordan@bulldozer-collective.comGet access to playbooks and feedback from those who are shaping the next wave of marketing and AI.