
AARRR Framework: Definition, Stages, KPIs and Examples (2026)

AARRR framework (pirate metrics): definition, the 5 stages, the KPIs to track at each, and the method to find where your B2B funnel is leaking.

Table of contents
Download icon
Resource
The 4 Stages of the Growth Process
Download
__wf_reserved_inherit

The AARRR framework — also called pirate metrics — is a growth management system introduced by Dave McClure in 2007 in "Startup Metrics for Pirates". It breaks down the customer lifecycle into 5 stages — Acquisition, Activation, Retention, Referral, Revenue — and ties each one to an objective, a key question and KPIs so you can see exactly where the funnel is leaking.

This article lays out the definition, details the 5 stages with the indicators to track, provides a summary table and shows how to apply the AARRR matrix in B2B — SaaS and services — where sales cycles are long and retention often carries more weight than acquisition.

What is the AARRR framework?

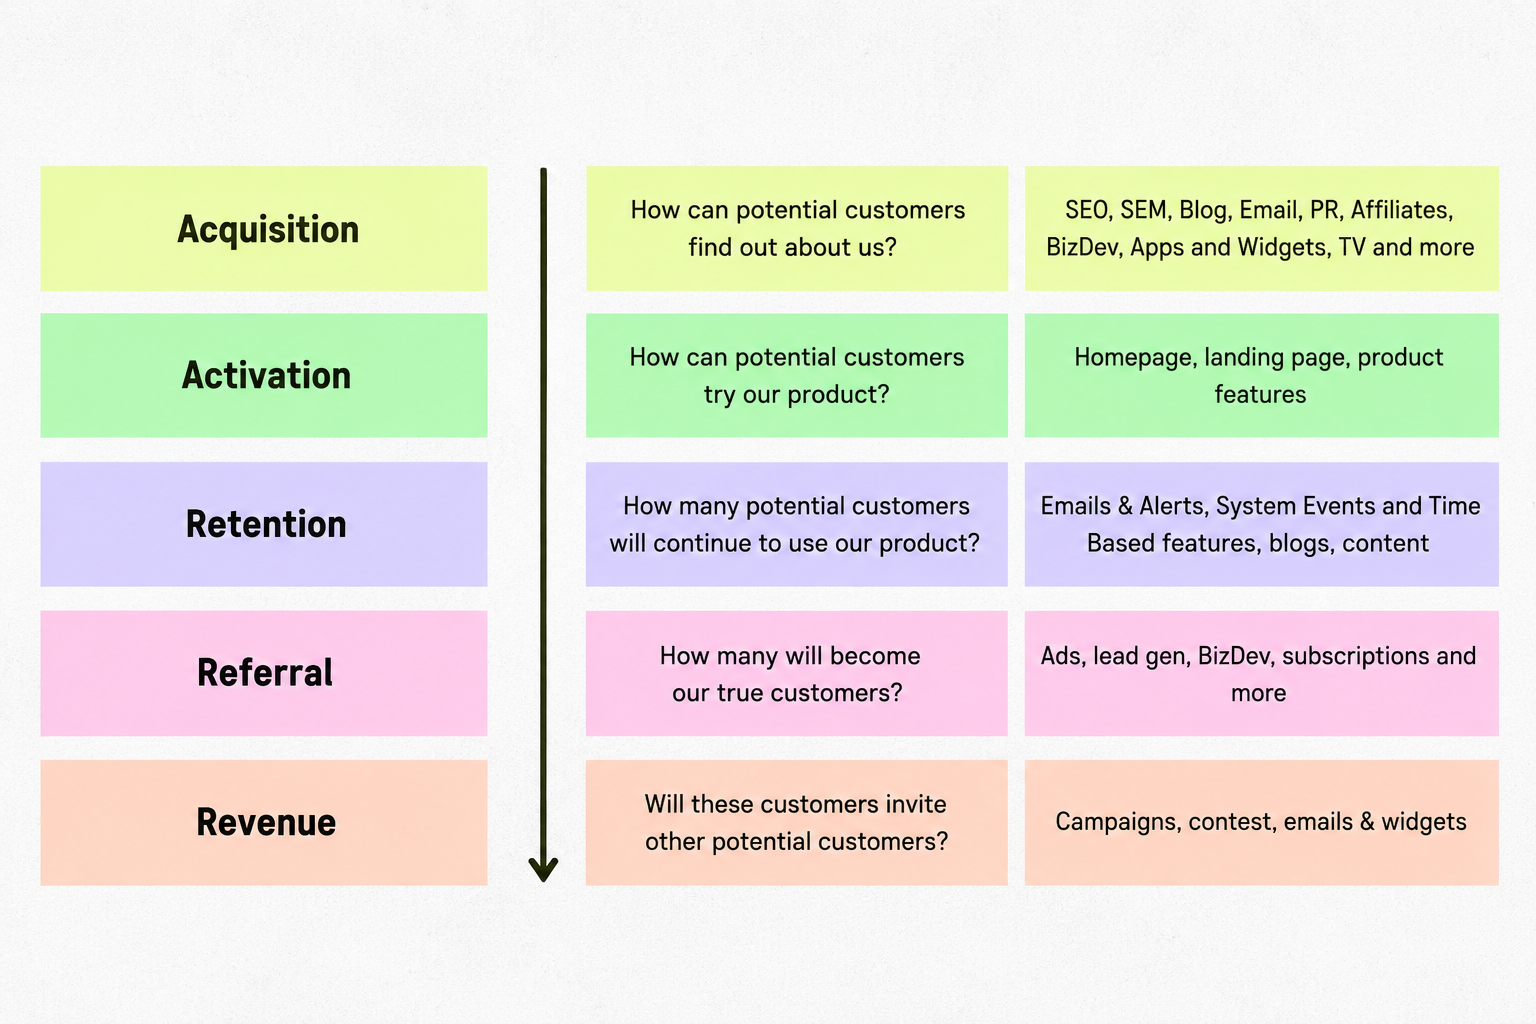
The AARRR framework, also known as the AARRR funnel, AARRR matrix, AARRR model or AARRR method, is an analytical grid for the customer lifecycle structured around 5 stages. Developed by Dave McClure, investor and founder of 500 Startups, it ties each stage to clear, actionable indicators rather than gut feel.

The 5 stages, known as pirate metrics:

  • Acquisition: attract new users through targeted marketing channels.
  • Activation: trigger a first experience of value with the product.
  • Retention: bring users back and keep them engaged.
  • Referral: turn satisfied users into growth engines.
  • Revenue: convert usage into revenue through subscriptions, purchases or upsells.

What the AARRR matrix is used for

A standard marketing funnel measures volumes. The AARRR matrix adds a stage-by-stage reading: where growth leaks, why, and which lever to pull first. In practice, it's used to:

  • Locate the funnel bottleneck rather than optimising everywhere at once.
  • Align marketing, product and sales around a shared dashboard, stage by stage.
  • Pick the actions that deliver the most growth for the least cost (improving retention often has a better ROI than topping up acquisition).
  • Run on data, through a repeatable growth hacking framework.

What are the stages of the AARRR framework?

Each stage of the customer lifecycle answers a different objective and is measured with its own KPIs. Together they form the AARRR funnel; taken individually, they help decide where to concentrate effort.

Summary: stage → objective → key question → KPIs

  • Acquisition — Objective: attract qualified traffic at the lowest CAC. Key question: which channels bring in the users who convert? KPIs: unique visitors, CTR, cost per lead, CAC, conversion rate by channel.
  • Activation — Objective: get users to the first moment of value. Key question: how many users see the promise in the first session? KPIs: activation rate, time to first key event, onboarding completion rate.
  • Retention — Objective: keep users engaged over time. Key question: how many come back at D+7, D+30, D+90? KPIs: retention rate at D+7 / 30 / 90, churn rate, recurring sessions per user, NPS.
  • Referral — Objective: have existing customers bring in new ones. Key question: how many prospects does one customer bring in on average? KPIs: NPS, referrals per active user, share rate, viral coefficient.
  • Revenue — Objective: maximise the value extracted from usage. Key question: how fast does LTV exceed CAC? KPIs: conversion rate to paying customer, ARPU, LTV, LTV/CAC, subscription churn rate.

Acquisition: attracting the right prospects

Acquisition covers all the levers that bring a visitor to your site, app or product. Objective: generate qualified traffic at the best customer acquisition cost (CAC).

Acquisition levers:

  • SEO: high-value content targeting the keywords that carry your offer.
  • SEA / paid ads: Google Ads, Meta, LinkedIn.
  • Content marketing: articles, whitepapers, studies, videos.
  • Organic and paid social: visibility in your ICP's feeds.
  • Email: sequences, nurturing, lead magnets.
  • Partnerships and affiliation: influence, co-marketing, media.

KPIs to track: unique visitors, CTR, cost per lead, CAC, conversion rate by channel.

In B2B: qualification matters more than volume. A good channel is one that brings in accounts that look like your best customers (size, sector, cycle). At this stage, the real question isn't "how many MQLs?" but "how many MQLs convert to SQLs within 60 days?".

💡 Tip: rather than spreading across every channel, focus on those generating the best conversion rates and a qualified audience.

Activation: triggering the first moment of value

Activation is the moment a user draws real, concrete value from the product: first report generated, first integration wired up, first useful demo. Objective: shorten the time between sign-up and that moment — the famous "aha moment".

Activation levers:

  • Onboarding UX: guided flows, walkthroughs, contextual pop-ups.
  • Entry offers: free trial, demo, scoped POC.
  • Personalisation: differentiated paths based on persona or declared use case.
  • Human support: in B2B, a dedicated CSM or sales rep during the first days.

KPIs to track: activation rate, time to first key event, onboarding completion rate, key actions completed in the first session.

In B2B: the activation point is often the first successful use after the demo — report shared internally, integration connected, second user invited. On long cycles, activation is measured at the account level, not just at the signatory.

💡 Growth hack: identify the product event that, when it happens within 14 days, makes the customer renew — then build onboarding around it.

Retention: keeping users engaged

Retention is the ability to maintain engagement over time. A strong retention rate signals that your value proposition addresses a recurring need. Objective: prevent churn and grow lifetime value (LTV).

Retention levers:

  • Automated re-engagement emails and useful content.
  • Product: regular updates, new features, in-app content.
  • Loyalty programmes and progressive benefits.
  • Customer relations: QBRs, proactive support, community.

KPIs to track: retention rate at D+7 / D+30 / D+90, churn rate, recurring sessions per user, post-usage NPS.

In B2B: retention plays out at the account level, not just the user level. A net revenue retention (NRR) of 100% means the base pays the same the following year despite departures; above that, expansion already offsets acquisition.

💡 Best practice: use a CRM or marketing automation tool to segment your user base and trigger the right message at the right time.

Referral: having customers bring in new customers

Referral turns satisfied users into growth engines. Objective: reduce overall CAC and amplify reach through customers themselves.

Referral levers:

  • Referral programmes with dual rewards (referrer and referred).
  • Easy sharing via WhatsApp, LinkedIn, email.
  • Exclusive offers for power users.
  • Ambassador programmes and dedicated status tiers.

KPIs to track: Net Promoter Score (NPS), number of referrals per active user, share rate, viral coefficient.

In B2B: referral takes the form of customer references (logos, case studies, warm intros) and partnerships. It isn't viral in the B2C sense; it's relational, so it needs tooling — a references page, an intro request at the end of an engagement cycle, a referral incentive on the buyer side.

💡 Key takeaway: beyond the funnel, referral feeds a growth loop — each customer brings in qualified prospects with no additional acquisition budget.

Revenue: converting usage into revenue

The final stage of the AARRR framework, monetisation consists of converting active usage into revenue, directly or indirectly. Objective: maximise average revenue per user (ARPU) and lifetime value (LTV), while keeping LTV/CAC above 3.

Revenue levers:

  • Freemium with a premium upgrade at a clear limit.
  • Monthly or annual subscriptions, with annual-plan discounts.
  • Upsell and cross-sell on accounts that cross a usage threshold.
  • Pricing tiers: plans by size or usage to accompany account growth.

KPIs to track: conversion rate to paying customer, subscription churn rate, ARPU, LTV, LTV/CAC.

In B2B: revenue is measured in MRR / ARR, and expansion (upsell, new seats, additional modules) often counts as much as the initial sale. Good pricing grows LTV without growing CAC.

💡 Key insight: improving retention is often the cheapest way to grow revenue. You first monetise usage that sticks, not usage you're trying to hold on to.

AARRR or RARRA: which order to work the stages in?

The AARRR sequence suggests you start with acquisition. In mature SaaS, that's rarely the right entry point. The RARRA variant (Retention, Activation, Referral, Revenue, Acquisition), popularised by Thomas Petit and Gabor Papp for mobile apps, flips the order: first make sure usage sticks, before pouring acquisition budget into a leaking funnel.

In practice, priority depends on the bottleneck. If NPS is low and churn is high, working on acquisition is like filling a leaking bucket. If retention is strong but volume is weak, acquisition becomes the highest-leverage move. The model stays the same; the order of attack adapts to your data.

How to apply the AARRR framework

The AARRR framework shouldn't be treated as a sequential checklist. It's a management tool for identifying the most profitable growth levers and concentrating effort where it will have the greatest impact.

The goal isn't to optimise every stage at once, but to spot the bottlenecks in your conversion funnel. Careful data analysis points to the critical stage — the one dragging down overall performance — and that's the one to work on first.

A targeted, agile and evolving approach

Every company, product and target audience has its own dynamics. The AARRR framework should therefore be treated as a modular system, tuned to:

  • the product's maturity (launch vs. scale),
  • the business model (SaaS, services, marketplace, e-commerce),
  • the target personas,
  • the resources available.

A single underperforming stage is enough to drag down the entire funnel. A few typical cases:

  • Strong traffic, few conversions → activation issue: the value proposition isn't landing fast enough, or the path is hiding it.
  • Mass sign-ups, inactive users → retention issue: onboarding is too heavy, or baseline usage doesn't yet carry clear value.
  • Engaged users, flat revenue → monetisation issue: pricing, tiers or upsell don't capture the perceived value.

Use cases: B2B SaaS and B2B services

The AARRR matrix adapts to each model. For a B2B ICP, two recurring cases.

B2B SaaS. The funnel starts from trial sign-up and reads as a series of conversion rates to monitor: visitor → trial, trial → activation (first key event in the first session), activation → paying conversion, paying conversion → month-3 retention, month-3 retention → expansion. The line to work on first is the one where the rate drops most compared to the previous cohort, and you compare cohorts month over month to isolate the effect of product changes.

B2B services (agency, consulting firm, boutique). The funnel rewrites itself: qualified visitor → qualified meeting → proposal → signature → upsell / renewal → referral (intros, co-cases). The highest-leverage move is rarely top-of-funnel acquisition; it's lifting the proposal → signature rate and the referral rate per engagement delivered.

💡 Key advice: whatever the model, applying the AARRR framework must be driven by data. Without a measured baseline, optimisation is guesswork.
‍

Best practices for applying the AARRR framework

To get the most out of the AARRR framework, go with a structured, data-centric approach and stay flexible in execution. This model isn't a magic formula — it's a continuous optimisation framework for the user lifecycle.

  1. Collect the right data: stage-specific KPIs (activation rate, retention rate, CAC, LTV, ARPU). Centralise into a CRM and an analytics tool (Google Analytics, Mixpanel, Amplitude).
  2. Prioritise by impact: work on the stage where the block costs the most in growth. A prioritisation matrix helps decide. No more than one stage worked at a time.
  3. Test, adjust, repeat: A/B tests, targeted experiments, pilot campaigns. Cross-reference quantitative data with qualitative user feedback.
  4. Avoid classic mistakes: optimising acquisition without activation behind it; monetising too fast; deciding on intuition rather than data.

More than a method, AARRR is a continuous learning mindset: test, measure, learn, adjust — until you've built a high-performing, durable marketing funnel.

‍

[rta-block=folder-cta][rta-title=h3]Want to learn more about your growth potential?[rta-title=h3][rta-btn=regular href="/prendre-rendez-vous-typeform" target=_blank]Get a free audit[rta-btn=regular][rta-block=folder-cta]

Should you add an Awareness stage in B2B?

The AAARRR variant adds an Awareness stage before acquisition. The idea: before pulling visitors to a site or app, make sure they already know the offer exists. In practice, it's everything that builds brand memory ahead of active search — branding, PR, influence, editorial SEO, organic social, partnerships, awareness advertising.

In long-cycle B2B, Awareness is rarely optional. On high tickets and multi-stakeholder decisions, buyers need to have seen your brand several times before they'll consider it. In those contexts — innovative products, competitive markets, premium, tech — Awareness smooths future conversion. Conversely, for an immediate need (emergency repair), go straight to acquisition.

FAQ — AARRR framework

What's the difference between AARRR and TOFU/MOFU/BOFU?

AARRR measures the customer lifecycle, from acquisition to revenue, with product KPIs (activation, retention) on top of marketing KPIs. TOFU/MOFU/BOFU breaks down the marketing funnel on the content side (awareness, consideration, decision). The two complement each other: AARRR tells you where the funnel leaks, TOFU/MOFU/BOFU tells you what content to feed it with.

In what order should you work the 5 stages?

In the order of the data, not alphabetical order. You identify the stage with the lowest conversion rate relative to the previous cohort and work on it first. In mature SaaS, that's often retention before acquisition (the RARRA model); at launch, it's activation right after acquisition.

Which KPIs should you track at each stage?

Acquisition: CAC, qualified traffic, conversion rate by channel. Activation: activation rate, time to first key event. Retention: retention rate at D+7 / D+30 / D+90, churn, NRR. Referral: NPS, referrals per active user, viral coefficient. Revenue: ARPU, LTV, LTV/CAC.

Does the AARRR framework work in B2B?

Yes, with two adaptations. Referral takes the form of customer references, intros and partnerships rather than viral referrals. Retention is measured at the account level (NRR, expansion) and often carries more weight than acquisition in the overall economics. The rest of the model holds as is.

Who invented the AARRR framework?

Dave McClure, investor and founder of 500 Startups, in a 2007 presentation titled "Startup Metrics for Pirates". The nickname pirate metrics comes from the initials — AARRR — which echo a pirate's call.

The essentials

The AARRR framework is a diagnostic tool more than a recipe. It answers one question at a time: which stage of the customer lifecycle is slowing growth the most, and why. In B2B, you adapt it by weighting retention and referral more heavily than in the original B2C reading. The rest is discipline: measure, prioritise, test, adjust — stage by stage.

Rich Text Attributes - Do not delete
This container will be hidden on the live page

Lorem ipsum

Book a demo
Killian Drecq
Killian Drecq
Rédacteur
Last update
November 7, 2026

Writer at Bulldozer, he covers web scraping, UGC and no-code, mixing data, storytelling and SEO.

Read more from this author

See more

To go further

Marketing Funnel: The Ultimate Guide to Improving Your Conversions
July 15, 2024
Growth
Charlotte Nowak
Marketing Funnel: The Ultimate Guide to Improving Your Conversions
UGC Marketing: Definition, Formats, Examples & Strategy 2026
April 24, 2025
Growth
Killian Drecq
UGC Marketing: Definition, Formats, Examples & Strategy 2026
AARRR Framework: Definition, Stages, KPIs and Examples (2026)
June 17, 2024
Growth
Killian Drecq
AARRR Framework: Definition, Stages, KPIs and Examples (2026)

Frequently asked questions

Can't find what you're looking for ? Contact us here

jordan@bulldozer-collective.com
What are the stages of the AARRR model?
The AARRR model, also known as the pirate funnel, describes five essential stages of the customer lifecycle. It begins with acquisition, which involves attracting a potential customer through different channels. Then comes activation, where the goal is to give them a first experience compelling enough to spark their interest. The retention phase aims to maintain a lasting relationship with this customer so that they keep using the product or service. With referral, satisfied customers become genuine ambassadors and help spread awareness of the brand. Finally, the revenue phase involves converting product usage into revenue. Together, these five stages form a complete conversion funnel, designed to attract new customers, retain them, and maximize growth.
Why use the AARRR framework in digital marketing?
Because it gives you a structured view of your marketing strategy. The AARRR model helps you analyze your metrics, reduce churn, improve the customer experience, and guide your decisions with concrete data. It's also a valuable tool for any growth hacker who wants to set up an effective growth hacking strategy, with a focus on customer satisfaction and long-term development.
How do you concretely apply the AARRR model in my company?
It all starts with a gradual rollout, which involves identifying the stage of the marketing funnel responsible for the bottleneck in your company's growth. For example, if you're struggling to convert your leads, it's essential to work on the activation phase. If your customers leave your service too quickly, you'll need to strengthen your customer service or automate your follow-ups. And if no one is talking about you, it becomes necessary to optimize the referral phase, notably through referral programs or by analyzing your NPS. Once this stage has been identified, all that's left is to test, measure, iterate... and start again. This is the very foundation of a continuous improvement strategy.
Which tools should you use to track the KPIs of the AARRR model?
There are many tools for tracking performance indicators at each stage of the conversion cycle. For data visualization, solutions like Google Analytics 4, Mixpanel, or Amplitude offer precise tracking of user behavior. In inbound marketing, platforms such as HubSpot, Brevo, or Mailchimp make it easier to create content and automate campaigns. To go further with marketing automation, tools like ActiveCampaign, Customer.io, or Zapier let you set up personalized scenarios. Finally, customer relationship management can be centralized in CRMs such as Pipedrive, Notion, or Monday. The goal is to build a clear dashboard tailored to your website or app, in order to effectively track the most important KPIs: activation rate, retention rate, LTV, revenue generated, churn, and many more.
What is the difference between AARRR and a classic marketing funnel?
A classic marketing funnel often stops at conversion. The AARRR funnel, on the other hand, goes further: it covers the entire customer lifecycle, from the first visit all the way to referral and the revenue generated. This is what makes it a tool for rapid growth, suited to companies that want to acquire new users, retain them, and grow their business model sustainably.
How do you align AARRR with your personas and your value proposition?
Start by defining your target audience (persona, needs, objections), then map each phase of the pirate funnel to a clear promise: an acquisition message via web channels, a first experience (onboarding), social proof for the recommendation phase, and offers suited to your business model. The result: a marketing strategy that speaks the customer's language and converts more new customers.
What role do social media and inbound marketing play?
Social media amplifies new-customer acquisition (reach, qualified traffic) and inbound marketing captures the prospect with useful content (articles, newsletter, checklist). Together, they generate a less costly first stage in the conversion funnel, improve the customer experience and nurture the relationship through to the final stage (revenue).
Which metrics should you track at each stage (the pirate metrics)?
For the acquisition phase, the essential metrics include the number of sessions per channel, cost per click (CPC), cost per lead (CPL) as well as the share of traffic coming from new users. Activation is measured through the sign-up rate, the time needed to reach the first meaningful experience, and the percentage of completed onboarding. Retention is assessed through churn reduction, return rates at D+7 and D+30, or the frequency of product usage. Referral relies on metrics like NPS, the share rate or the number of referrals generated. Finally, revenue is tracked via the conversion rate to a paid plan, ARPU and customer lifetime value (LTV). All these indicators should ideally be centralized in a single dashboard to make overall performance management easier.
How does marketing automation help retention and referral?
Automation scenarios (emails, in-app, SMS) triggered by website events: onboarding reminder, customer service tips, cart recovery, review requests in the recommendation phase. Goals: maximize usage, reduce churn, encourage the potential customer to become a new customer... then recommend your brand.
Does the AARRR matrix have different use cases depending on the sector?
For SaaS companies, the priority is on activation and retention, with regular tests on pricing and the implementation of a free trial. In e-commerce, the focus is on funnel-marketing-oriented campaigns, product-page optimization and upsell strategies. Mobile apps should favor a short onboarding, the thoughtful use of push notifications and marketing automation. As for media and communities, they rely above all on SEO, the newsletter, a regular publishing frequency and user-generated content (UGC). In all cases, the AARRR method remains an essential reference for assessing and growing your company in a way that is strategic and adaptable to different models.
Newsletter

Join those who are redefining AI-driven growth.

Get access to playbooks and feedback from those who are shaping the next wave of marketing and AI.


Thank you! Your submission has been received!
Oops! Something went wrong while submitting the form.

Let’s grow!

From first pipeline to sustained growth
Leo Lacoste
Léo Lacoste
business partner